前言
本文的内容都是用jupyter notebook执行的。
以下是本篇文章正文内容
引入库
from openpyxl import Workbook,load_workbook
from openpyxl.styles import *


import warnings
warnings.filterwarnings('ignore')
基本操作
创建新的工作薄
wb1 = Workbook()
加载已存在的工作簿
wb = load_workbook('./000.xlsx')
创建新的工作表
ws1 = wb.create_sheet('111')
当前工作表
ws2 = wb.active
ws2.title
‘000’
指定工作表
ws = wb['000']
已存在的全部工作簿
wb.sheetnames
[‘000’, ‘111’]
选择单个单元格
ws['A1']
ws.cell(1,1)
单元格属性
cell = ws['A1']
- 单元格列索引
cell.col_idx
cell.column
- 单元格列索引
cell.row
- 单元格列名
cell.column_letter
‘A’
- 单元格的坐标
cell.coordinate
‘A1’
- 单元格数字类型
默认是n 数值
s 字符串
d 日期时间
cell.data_type
‘n’
- 单元格编码格式,默认 utf-8
cell.encoding
‘utf-8’
- 是否有样式
cell.has_style
False
- 单元格样式
cell.style
‘Normal’
- 单元格样式id
cell.style_id
0
单元格的样式属性
属性样式会在后面设置中详细演示,此处只做查询
cell.font
<openpyxl.styles.fonts.Font object>
Parameters:
name=‘Calibri’, charset=None, family=2.0, b=False, i=False, strike=None, outline=None, shadow=None, condense=None, color=<openpyxl.styles.colors.Color object>
Parameters:
rgb=None, indexed=None, auto=None, theme=1, tint=0.0, type=‘theme’, extend=None, sz=11.0, u=None, vertAlign=None, scheme=‘minor’
cell.alignment
<openpyxl.styles.alignment.Alignment object>
Parameters:
horizontal=None, vertical=None, textRotation=0, wrapText=None, shrinkToFit=None, indent=0.0, relativeIndent=0.0, justifyLastLine=None, readingOrder=0.0
cell.border
<openpyxl.styles.borders.Border object>
Parameters:
outline=True, diagonalUp=False, diagonalDown=False, start=None, end=None, left=<openpyxl.styles.borders.Side object>
Parameters:
style=None, color=None, right=<openpyxl.styles.borders.Side object>
Parameters:
style=None, color=None, top=<openpyxl.styles.borders.Side object>
Parameters:
style=None, color=None, bottom=<openpyxl.styles.borders.Side object>
Parameters:
style=None, color=None, diagonal=<openpyxl.styles.borders.Side object>
Parameters:
style=None, color=None, vertical=None, horizontal=None
cell.fill
<openpyxl.styles.fills.PatternFill object>
Parameters:
patternType=None, fgColor=<openpyxl.styles.colors.Color object>
Parameters:
rgb=‘00000000’, indexed=None, auto=None, theme=None, tint=0.0, type=‘rgb’, bgColor=<openpyxl.styles.colors.Color object>
Parameters:
rgb=‘00000000’, indexed=None, auto=None, theme=None, tint=0.0, type=‘rgb’
cell.number_format
‘General’
cell.hyperlink
单元格的值
ws['A1'].value
选择单元格
一列 字符串
ws['A']
(<Cell ‘000’.A1>,
<Cell ‘000’.A2>,
<Cell ‘000’.A3>,
<Cell ‘000’.A4>,
<Cell ‘000’.A5>,
<Cell ‘000’.A6>,
<Cell ‘000’.A7>,
<Cell ‘000’.A8>,
<Cell ‘000’.A9>,
<Cell ‘000’.A10>,
<Cell ‘000’.A11>)
一行,数字
ws[1]
(<Cell ‘000’.A1>, <Cell ‘000’.B1>, <Cell ‘000’.C1>, <Cell ‘000’.D1>)
ws['A:B']
((<Cell ‘000’.A1>,
<Cell ‘000’.A2>,
<Cell ‘000’.A3>,
<Cell ‘000’.A4>,
<Cell ‘000’.A5>,
<Cell ‘000’.A6>,
<Cell ‘000’.A7>,
<Cell ‘000’.A8>,
<Cell ‘000’.A9>,
<Cell ‘000’.A10>,
<Cell ‘000’.A11>),
(<Cell ‘000’.B1>,
<Cell ‘000’.B2>,
<Cell ‘000’.B3>,
<Cell ‘000’.B4>,
<Cell ‘000’.B5>,
<Cell ‘000’.B6>,
<Cell ‘000’.B7>,
<Cell ‘000’.B8>,
<Cell ‘000’.B9>,
<Cell ‘000’.B10>,
<Cell ‘000’.B11>))
多行
ws[5:10]
((<Cell ‘000’.A5>, <Cell ‘000’.B5>, <Cell ‘000’.C5>, <Cell ‘000’.D5>),
(<Cell ‘000’.A6>, <Cell ‘000’.B6>, <Cell ‘000’.C6>, <Cell ‘000’.D6>),
(<Cell ‘000’.A7>, <Cell ‘000’.B7>, <Cell ‘000’.C7>, <Cell ‘000’.D7>),
(<Cell ‘000’.A8>, <Cell ‘000’.B8>, <Cell ‘000’.C8>, <Cell ‘000’.D8>),
(<Cell ‘000’.A9>, <Cell ‘000’.B9>, <Cell ‘000’.C9>, <Cell ‘000’.D9>),
(<Cell ‘000’.A10>, <Cell ‘000’.B10>, <Cell ‘000’.C10>, <Cell ‘000’.D10>))
ws['A3:B9']
((<Cell ‘000’.A3>, <Cell ‘000’.B3>),
(<Cell ‘000’.A4>, <Cell ‘000’.B4>),
(<Cell ‘000’.A5>, <Cell ‘000’.B5>),
(<Cell ‘000’.A6>, <Cell ‘000’.B6>),
(<Cell ‘000’.A7>, <Cell ‘000’.B7>),
(<Cell ‘000’.A8>, <Cell ‘000’.B8>),
(<Cell ‘000’.A9>, <Cell ‘000’.B9>))
单元格赋值
ws['A1'] = 20
ws.cell(2,2).value
‘陈桂荣’
当使用cell() 时,只能给value属性赋值
ws.cell(2,2).value = 30
增加一行
ws.append([1,2,3])
单元格遍历
ws.values 返回的是生成器,是将一行数据作为一个元组单元组成的,是由值组成的
ws.values 获取的内容是从 “A1” 到 “最大行最大列”
ws.values
<generator object values at 0x00000297EAB07F68>
for i in ws.values:
    print(i)
(20, ‘NAME’, ‘DATE_TIME’, ‘PAY’)
(0, 30, datetime.datetime(1972, 2, 23, 3, 10, 2), 8803)
(1, ‘黄瑞’, datetime.datetime(1977, 11, 29, 4, 49, 16), 5951)
(2, ‘李阳’, datetime.datetime(1982, 8, 30, 18, 12, 46), 7418)
(3, ‘石淑英’, datetime.datetime(2016, 4, 18, 11, 24, 17), 737)
(4, ‘陈红霞’, datetime.datetime(2011, 12, 12, 3, 12, 47, 1), 3555)
(5, ‘廖健’, datetime.datetime(1989, 9, 25, 20, 9, 45, 1), 2649)
(6, ‘韩雪梅’, datetime.datetime(2002, 1, 2, 8, 0, 51), 7344)
(7, ‘赵丽丽’, datetime.datetime(2018, 7, 1, 19, 35, 24), 8735)
(8, ‘侯建华’, datetime.datetime(1971, 8, 1, 16, 59, 1), 6148)
(9, ‘谭桂花’, datetime.datetime(2000, 4, 7, 5, 2, 38), 8900)
(1, 2, 3, None)
for i in ws.iter_rows(min_col=1,max_col=3,min_row=1,max_row=10):
    print(i)
(<Cell ‘000’.A1>, <Cell ‘000’.B1>, <Cell ‘000’.C1>)
(<Cell ‘000’.A2>, <Cell ‘000’.B2>, <Cell ‘000’.C2>)
(<Cell ‘000’.A3>, <Cell ‘000’.B3>, <Cell ‘000’.C3>)
(<Cell ‘000’.A4>, <Cell ‘000’.B4>, <Cell ‘000’.C4>)
(<Cell ‘000’.A5>, <Cell ‘000’.B5>, <Cell ‘000’.C5>)
(<Cell ‘000’.A6>, <Cell ‘000’.B6>, <Cell ‘000’.C6>)
(<Cell ‘000’.A7>, <Cell ‘000’.B7>, <Cell ‘000’.C7>)
(<Cell ‘000’.A8>, <Cell ‘000’.B8>, <Cell ‘000’.C8>)
(<Cell ‘000’.A9>, <Cell ‘000’.B9>, <Cell ‘000’.C9>)
(<Cell ‘000’.A10>, <Cell ‘000’.B10>, <Cell ‘000’.C10>)
ws.iter_rows()
<generator object Worksheet._cells_by_row at 0x00000297EAB623B8>
ws.rows
<generator object Worksheet._cells_by_row at 0x00000297EAB62518>
是将一行单元格作为元组单元组成的生成器,与ws.values的区别是,rows返回的是由单元格组成的元组,values是由值组成的
import random
for i in ws.rows:
    for j in i:
        print(j,j.value)
<Cell ‘000’.A1> 20
<Cell ‘000’.B1> NAME
<Cell ‘000’.C1> DATE_TIME
<Cell ‘000’.D1> PAY
<Cell ‘000’.A2> 0
<Cell ‘000’.B2> 30
<Cell ‘000’.C2> 1972-02-23 03:10:02
<Cell ‘000’.D2> 8803
<Cell ‘000’.A3> 1
<Cell ‘000’.B3> 黄瑞
<Cell ‘000’.C3> 1977-11-29 04:49:16
<Cell ‘000’.D3> 5951
<Cell ‘000’.A4> 2
<Cell ‘000’.B4> 李阳
<Cell ‘000’.C4> 1982-08-30 18:12:46
<Cell ‘000’.D4> 7418
<Cell ‘000’.A5> 3
<Cell ‘000’.B5> 石淑英
<Cell ‘000’.C5> 2016-04-18 11:24:17
<Cell ‘000’.D5> 737
<Cell ‘000’.A6> 4
<Cell ‘000’.B6> 陈红霞
<Cell ‘000’.C6> 2011-12-12 03:12:47.000001
<Cell ‘000’.D6> 3555
<Cell ‘000’.A7> 5
<Cell ‘000’.B7> 廖健
<Cell ‘000’.C7> 1989-09-25 20:09:45.000001
<Cell ‘000’.D7> 2649
<Cell ‘000’.A8> 6
<Cell ‘000’.B8> 韩雪梅
<Cell ‘000’.C8> 2002-01-02 08:00:51
<Cell ‘000’.D8> 7344
<Cell ‘000’.A9> 7
<Cell ‘000’.B9> 赵丽丽
<Cell ‘000’.C9> 2018-07-01 19:35:24
<Cell ‘000’.D9> 8735
<Cell ‘000’.A10> 8
<Cell ‘000’.B10> 侯建华
<Cell ‘000’.C10> 1971-08-01 16:59:01
<Cell ‘000’.D10> 6148
<Cell ‘000’.A11> 9
<Cell ‘000’.B11> 谭桂花
<Cell ‘000’.C11> 2000-04-07 05:02:38
<Cell ‘000’.D11> 8900
<Cell ‘000’.A12> 1
<Cell ‘000’.B12> 2
<Cell ‘000’.C12> 3
<Cell ‘000’.D12> None
- rows 和 iter_row()的区别在于,iter_row()可以指定区域,rows是全部单元格
columns 、iter_col() 是按列
ws.columns
<generator object Worksheet._cells_by_col at 0x00000297EAB627D8>
for i in ws.columns:
    print(i)
(<Cell ‘000’.A1>, <Cell ‘000’.A2>, <Cell ‘000’.A3>, <Cell ‘000’.A4>, <Cell ‘000’.A5>, <Cell ‘000’.A6>, <Cell ‘000’.A7>, <Cell ‘000’.A8>, <Cell ‘000’.A9>, <Cell ‘000’.A10>, <Cell ‘000’.A11>, <Cell ‘000’.A12>)
(<Cell ‘000’.B1>, <Cell ‘000’.B2>, <Cell ‘000’.B3>, <Cell ‘000’.B4>, <Cell ‘000’.B5>, <Cell ‘000’.B6>, <Cell ‘000’.B7>, <Cell ‘000’.B8>, <Cell ‘000’.B9>, <Cell ‘000’.B10>, <Cell ‘000’.B11>, <Cell ‘000’.B12>)
(<Cell ‘000’.C1>, <Cell ‘000’.C2>, <Cell ‘000’.C3>, <Cell ‘000’.C4>, <Cell ‘000’.C5>, <Cell ‘000’.C6>, <Cell ‘000’.C7>, <Cell ‘000’.C8>, <Cell ‘000’.C9>, <Cell ‘000’.C10>, <Cell ‘000’.C11>, <Cell ‘000’.C12>)
(<Cell ‘000’.D1>, <Cell ‘000’.D2>, <Cell ‘000’.D3>, <Cell ‘000’.D4>, <Cell ‘000’.D5>, <Cell ‘000’.D6>, <Cell ‘000’.D7>, <Cell ‘000’.D8>, <Cell ‘000’.D9>, <Cell ‘000’.D10>, <Cell ‘000’.D11>, <Cell ‘000’.D12>)
ws.iter_cols(min_col=1,max_col=3,min_row=1,max_row=10)
<generator object Worksheet._cells_by_col at 0x00000297EAB62A40>
最大行、最大列
ws.max_column
4
ws.max_row
12
删除行或者列
注意,删除行或者列后,后面的行或者列会自动往前填充,也就是说,删除第一列,原来的第二列就会变成第一列
ws.cell(1,2).value
‘NAME’
ws.delete_cols(1)
ws.cell(1,1).value
‘NAME’
ws.delete_rows(3)
for i in ws.rows:
    for j in i:
        print(j,j.value)
<Cell ‘000’.A1> NAME
<Cell ‘000’.B1> DATE_TIME
<Cell ‘000’.C1> PAY
<Cell ‘000’.A2> 30
<Cell ‘000’.B2> 1972-02-23 03:10:02
<Cell ‘000’.C2> 8803
<Cell ‘000’.A3> 李阳
<Cell ‘000’.B3> 1982-08-30 18:12:46
<Cell ‘000’.C3> 7418
<Cell ‘000’.A4> 石淑英
<Cell ‘000’.B4> 2016-04-18 11:24:17
<Cell ‘000’.C4> 737
<Cell ‘000’.A5> 陈红霞
<Cell ‘000’.B5> 2011-12-12 03:12:47.000001
<Cell ‘000’.C5> 3555
<Cell ‘000’.A6> 廖健
<Cell ‘000’.B6> 1989-09-25 20:09:45.000001
<Cell ‘000’.C6> 2649
<Cell ‘000’.A7> 韩雪梅
<Cell ‘000’.B7> 2002-01-02 08:00:51
<Cell ‘000’.C7> 7344
<Cell ‘000’.A8> 赵丽丽
<Cell ‘000’.B8> 2018-07-01 19:35:24
<Cell ‘000’.C8> 8735
<Cell ‘000’.A9> 侯建华
<Cell ‘000’.B9> 1971-08-01 16:59:01
<Cell ‘000’.C9> 6148
<Cell ‘000’.A10> 谭桂花
<Cell ‘000’.B10> 2000-04-07 05:02:38
<Cell ‘000’.C10> 8900
<Cell ‘000’.A11> 2
<Cell ‘000’.B11> 3
<Cell ‘000’.C11> None
转pandas
import pandas as pd
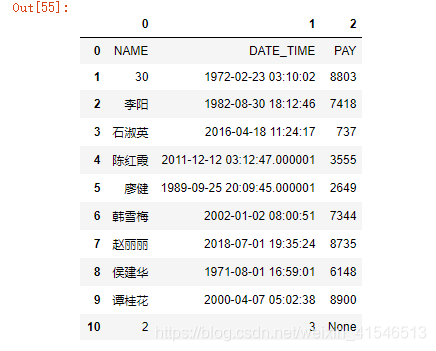
df = pd.DataFrame(ws.values)
df
for i in df.values:
    ws.append(i.tolist())
for i in ws.rows:
    for j in i:
        print(j,j.value,end=',')
    print('')
<Cell ‘000’.A1> NAME,<Cell ‘000’.B1> DATE_TIME,<Cell ‘000’.C1> PAY,
<Cell ‘000’.A2> 30,<Cell ‘000’.B2> 1972-02-23 03:10:02,<Cell ‘000’.C2> 8803,
<Cell ‘000’.A3> 李阳,<Cell ‘000’.B3> 1982-08-30 18:12:46,<Cell ‘000’.C3> 7418,
<Cell ‘000’.A4> 石淑英,<Cell ‘000’.B4> 2016-04-18 11:24:17,<Cell ‘000’.C4> 737,
<Cell ‘000’.A5> 陈红霞,<Cell ‘000’.B5> 2011-12-12 03:12:47.000001,<Cell ‘000’.C5> 3555,
<Cell ‘000’.A6> 廖健,<Cell ‘000’.B6> 1989-09-25 20:09:45.000001,<Cell ‘000’.C6> 2649,
<Cell ‘000’.A7> 韩雪梅,<Cell ‘000’.B7> 2002-01-02 08:00:51,<Cell ‘000’.C7> 7344,
<Cell ‘000’.A8> 赵丽丽,<Cell ‘000’.B8> 2018-07-01 19:35:24,<Cell ‘000’.C8> 8735,
<Cell ‘000’.A9> 侯建华,<Cell ‘000’.B9> 1971-08-01 16:59:01,<Cell ‘000’.C9> 6148,
<Cell ‘000’.A10> 谭桂花,<Cell ‘000’.B10> 2000-04-07 05:02:38,<Cell ‘000’.C10> 8900,
<Cell ‘000’.A11> 2,<Cell ‘000’.B11> 3,<Cell ‘000’.C11> None,
<Cell ‘000’.A12> NAME,<Cell ‘000’.B12> DATE_TIME,<Cell ‘000’.C12> PAY,
<Cell ‘000’.A13> 30,<Cell ‘000’.B13> 1972-02-23 03:10:02,<Cell ‘000’.C13> 8803,
<Cell ‘000’.A14> 李阳,<Cell ‘000’.B14> 1982-08-30 18:12:46,<Cell ‘000’.C14> 7418,
<Cell ‘000’.A15> 石淑英,<Cell ‘000’.B15> 2016-04-18 11:24:17,<Cell ‘000’.C15> 737,
<Cell ‘000’.A16> 陈红霞,<Cell ‘000’.B16> 2011-12-12 03:12:47.000001,<Cell ‘000’.C16> 3555,
<Cell ‘000’.A17> 廖健,<Cell ‘000’.B17> 1989-09-25 20:09:45.000001,<Cell ‘000’.C17> 2649,
<Cell ‘000’.A18> 韩雪梅,<Cell ‘000’.B18> 2002-01-02 08:00:51,<Cell ‘000’.C18> 7344,
<Cell ‘000’.A19> 赵丽丽,<Cell ‘000’.B19> 2018-07-01 19:35:24,<Cell ‘000’.C19> 8735,
<Cell ‘000’.A20> 侯建华,<Cell ‘000’.B20> 1971-08-01 16:59:01,<Cell ‘000’.C20> 6148,
<Cell ‘000’.A21> 谭桂花,<Cell ‘000’.B21> 2000-04-07 05:02:38,<Cell ‘000’.C21> 8900,
<Cell ‘000’.A22> 2,<Cell ‘000’.B22> 3,<Cell ‘000’.C22> None,
合并单元格
ws.merge_cells("A1:B1")
ws.merge_cells(start_column=3,end_column=6,start_row=2,end_row=3)
已存在的合并单元格
ws.merged_cells
<MultiCellRange [A1:B1 C2:F3]>
已存在的合并单元格列表
ws.merged_cell_ranges
[< CellRange A1:B1>, < CellRange C2:F3>]
ws['A1'].value
‘NAME’
ws['B1'].value
合并后的单元格,只会保留最上角的值,其他单元格的值全部为空(None)
过滤和排序
实际上,openpyxl可以添加过滤和排序,但是并不会起作用
ws.auto_filter.ref = "A:B"
```python
ws.auto_filter.add_filter_column(0, ['ASC','DWS']) ws.auto_filter.add_sort_condition("B2:B15")
### 样式设置

#### 颜色

```python

    Color(index=0)

    Color(rgb='00000000')

    COLOR_INDEX = (
        '00000000', '00FFFFFF', '00FF0000', '0000FF00', '000000FF',
        '00FFFF00', '00FF00FF', '0000FFFF', '00000000', '00FFFFFF',
        '00FF0000', '0000FF00', '000000FF', '00FFFF00', '00FF00FF',
        '0000FFFF', '00800000', '00008000', '00000080', '00808000',
        '00800080', '00008080', '00C0C0C0', '00808080', '009999FF',
        '00993366', '00FFFFCC', '00CCFFFF', '00660066', '00FF8080',
        '000066CC', '00CCCCFF', '00000080', '00FF00FF', '00FFFF00',
        '0000FFFF', '00800080', '00800000', '00008080', '000000FF',
        '0000CCFF', '00CCFFFF', '00CCFFCC', '00FFFF99', '0099CCFF',
        '00FF99CC', '00CC99FF', '00FFCC99', '003366FF', '0033CCCC',
        '0099CC00', '00FFCC00', '00FF9900', '00FF6600', '00666699',
        '00969696', '00003366', '00339966', '00003300', '00333300',
        '00993300', '00993366', '00333399', '00333333',
    )
    BLACK = COLOR_INDEX[0]
    WHITE = COLOR_INDEX[1]
    RED = COLOR_INDEX[2]
    DARKRED = COLOR_INDEX[8]
    BLUE = COLOR_INDEX[4]
    DARKBLUE = COLOR_INDEX[12]
    GREEN = COLOR_INDEX[3]
    DARKGREEN = COLOR_INDEX[9]
    YELLOW = COLOR_INDEX[5]
    DARKYELLOW = COLOR_INDEX[19]
字体
ws.cell(5,3).value='哈哈哈'
ws.cell(5,3).font = Font(name='仿宋',size=12,color=Color(index=0),b=True,i=True)
边框
    Side(style='thin',color=Color(index=0))

    style = ('dashDot','dashDotDot', 'dashed','dotted',
    'double','hair', 'medium', 'mediumDashDot', 'mediumDashDotDot',
    'mediumDashed', 'slantDashDot', 'thick', 'thin')

    Border(left=Side(),
          right=Side(),
          top=Side(),
          bottom=Side())
```python
```python
ws.cell(3,3).border = Border()
填充
    PatternFill(patternType='solid',fgColor=Color(), bgColor=Color())

    patternType = {'darkDown', 'darkUp', 'lightDown', 'darkGrid', 'lightVertical',
                   'solid', 'gray0625', 'darkHorizontal', 'lightGrid', 'lightTrellis',
                   'mediumGray', 'gray125', 'darkGray', 'lightGray', 'lightUp',
                   'lightHorizontal', 'darkTrellis', 'darkVertical'}

    ws.cell(3,3).fill = PatternFill()
对齐
    Alignment(horizontal='fill',vertical='center')

    horizontal = {'fill', 'distributed', 'centerContinuous', 'right',
                  'justify', 'center', 'left', 'general'}

    vertical = {'distributed', 'justify', 'center', 'bottom', 'top'}

    ws.cell(3,3).alignment= Alignment()
数字显示样式
设置工作薄自动识别单元格样式
wb.guess_types = True
当设置为自动识别后,单元格赋值python类型即可,会自动识别为Excel的数字类型
ws['A11'] = '2020-09-22'
ws['A11'].value
‘2020-09-22’
ws['A11'].data_type
‘s’
ws['A11'].number_format
'General'
import datetime
ws['B11'] = datetime.datetime.now()
ws['B11'].value
datetime.datetime(2020, 11, 8, 9, 25, 37, 657654)
ws['B11'].number_format
'yyyy-mm-dd h:mm:ss'
ws['B11'].data_type
'd'
也可以使用内建样式
ws['B5'] = 50000

ws['B5'].number_format = '#,##0'

ws['B5'].data_type
'n'
也可以自定义样式
ws['B6'].number_format = 'yyyy-mm-dd'

ws['B6'] = datetime.datetime.now()

ws['B6'].value
datetime.datetime(2020, 11, 8, 9, 25, 37, 722481)
ws['B6'].data_type
'd'
内建数字样式
    BUILTIN_FORMATS = {
        0: 'General',
        1: '0',
        2: '0.00',
        3: '#,##0',
        4: '#,##0.00',
        5: '"$"#,##0_);("$"#,##0)',
        6: '"$"#,##0_);[Red]("$"#,##0)',
        7: '"$"#,##0.00_);("$"#,##0.00)',
        8: '"$"#,##0.00_);[Red]("$"#,##0.00)',
        9: '0%',
        10: '0.00%',
        11: '0.00E+00',
        12: '# ?/?',
        13: '# ??/??',
        14: 'mm-dd-yy',
        15: 'd-mmm-yy',
        16: 'd-mmm',
        17: 'mmm-yy',
        18: 'h:mm AM/PM',
        19: 'h:mm:ss AM/PM',
        20: 'h:mm',
        21: 'h:mm:ss',
        22: 'm/d/yy h:mm',

        37: '#,##0_);(#,##0)',
        38: '#,##0_);[Red](#,##0)',
        39: '#,##0.00_);(#,##0.00)',
        40: '#,##0.00_);[Red](#,##0.00)',

        41: r'_(* #,##0_);_(* \(#,##0\);_(* "-"_);_(@_)',
        42: r'_("$"* #,##0_);_("$"* \(#,##0\);_("$"* "-"_);_(@_)',
        43: r'_(* #,##0.00_);_(* \(#,##0.00\);_(* "-"??_);_(@_)',

        44: r'_("$"* #,##0.00_)_("$"* \(#,##0.00\)_("$"* "-"??_)_(@_)',
        45: 'mm:ss',
        46: '[h]:mm:ss',
        47: 'mmss.0',
        48: '##0.0E+0',
        49: '@', }
链接
- Excel的链接公式
ws['C5'].value = '=HYPERLINK("#Sheet!B2","名称")'
- hyperlink参数
from openpyxl.worksheet.hyperlink import Hyperlink
ws['C6'].hyperlink = Hyperlink(ref='',location='Sheet!H5',target='')
ws['C6'].value = '这是链接'
target : 目标文件
location :目标单元格 工作表名 + ! + 单元格名
如果需要显示蓝色字体和下划线,需要设置字体
link = NamedStyle(name='link',font=Font(color=colors.BLUE,underline='single'))

ws['C6'].style = link
多个样式设置整合
    bbb = NamedStyle(name='bbb',
               font=Font(color=colors.BLUE),
               fill=PatternFill(fgColor=Color(index=0)),
               border=Border(left=Side(style='medium',color=Color(theme=6,tint=0.6)),
                             right=Side(style='medium',color='FFBB00'),
                             top=Side(),
                             bottom=Side()),
               alignment=Alignment(horizontal='center',vertical='top')
              )
可以将样式添加到工作薄,可以直接用字符串的形式赋值样式
wb.add_named_style(bbb)
ws['A5'].style=bbb
ws['A5'].value='自定义样式'
ws['A10'].style = 'bbb'
ws['A10'].style_id
3
ws['A10'].has_style
True
行高 列宽
row =ws.row_dimensions[1]

row.height = 15

col = ws.column_dimensions['E']
col.width = 10
保存工作薄
wb.save('./000.xlsx')
总结
以上就是本篇的全部内容,本文仅仅简单介绍了openpyxl中常用属性及方法的使用,每个程序员的代码就像他们自己的内裤,有些人愿意露有些人不愿意露,而我只喜欢看,然后找到喜欢的,偷偷收藏起来。